
In this final part of the bergw.xyz blog series, we’ll look at the monitoring, reporting and alerting setup.
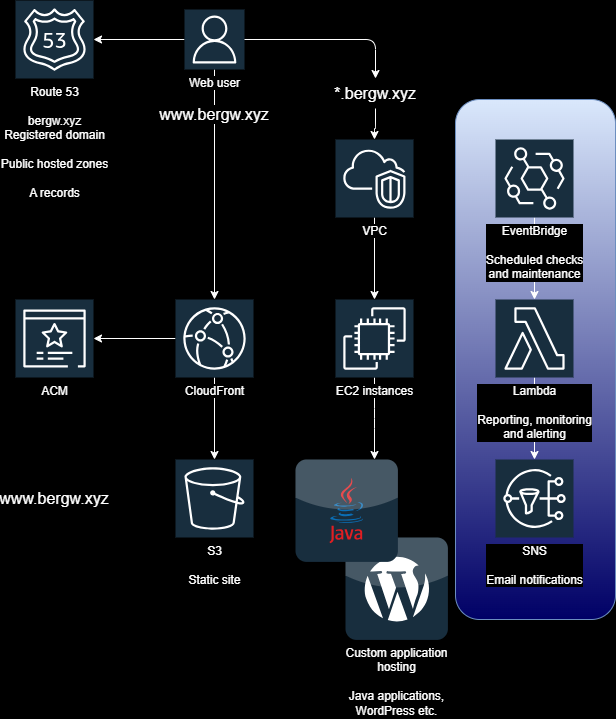
Two report-generating Lambda functions run regularly according to scheduled EventBridge rules and report to me on an SNS topic that drops me an email.
- bergw-xyz-healthcheck-hourly: simply makes requests to each of my services and warns me if any of them don’t respond with a 200 OK.
- bergw-xyz-report-pagehits-daily: sends a general report of hit counts and return codes for all endpoints in all domains:
Subject: 24 hour paths web hits
bergw.xyz

Hits  Path
--------------------------------------------------
18    GET "/", parameters={} Completed 301 MOVED_PERMANENTLY
13    GET "/error", parameters={} Exiting from "ERROR" dispatch, status 404
[ Note: a lot of scanner spam removed from this email... ]


www.bergw.xyz

Hits  Path
--------------------------------------------------
27    / 200
12    / 301
3     /favicon.ico 404
3     /robots.txt 200
[ ... ]
The Spring Boot application serving bergw.xyz logs to a CloudWatch log group, and access to the S3 bucket that serves www.bergw.xyz is logged to another bucket. This Lambda parses both these sources to compile this email, in 24-hour windows.
CloudWatch alerts for CPU utilisation
In addition to the service-level alerting, CloudWatch uses the same SNS topic as the Lambda to notify me of abnormally high EC2 instance CPU utilisation.
Leave a Reply