In this technical breakdown, I describe some easy-to-implement load testing that I carried out in order to get a rough idea of how much traffic this blog can handle, before I need to upgrade to a scaling infrastructure.
In part 4 of the site design and architecture blog series, I described how this blog runs on a single, non-scaling EC2 instance, and discussed potential alternatives for the infrastructure. But how much traffic can the single instance handle before we need to think about upgrading?
Let’s pick a web page and subject it to increasing load until the server begins to slow down. The part 3 post is pretty representative of the posts on my blog, containing a combination of text and images, and served with the common scripts and resources. And who knows, a million people might wake up one day with the desire to run a website out of an S3 bucket, having received the URL to that post in their dreams.
A simple way of testing server responsiveness is using a terminal HTTP client like wget or curl to fetch the URL. Running curl a few times shows that the first request is uncached, taking over a second to load, with subsequent requests under half a second.
$ time curl https://blog.bergw.xyz/2025/03/22/bergw-xyz-site-design-and-architecture-part-3-www/ 1> /dev/null
[...]
real    0m1.315s
[...]
$ time curl https://blog.bergw.xyz/2025/03/22/bergw-xyz-site-design-and-architecture-part-3-www/ 1> /dev/null
[...]
real    0m0.230s
[...]
$ time curl https://blog.bergw.xyz/2025/03/22/bergw-xyz-site-design-and-architecture-part-3-www/ 1> /dev/null
[...]
real    0m0.245s
[...]
$ time curl https://blog.bergw.xyz/2025/03/22/bergw-xyz-site-design-and-architecture-part-3-www/ 1> /dev/null
[...]
real    0m0.366s
[...]
curl isn’t a web browser — all it does is ask the server for the document at the specified URL. It doesn’t run scripts or fetch media, which constitute a large proportion of the data that the server needs to transmit. However, terminal commands are much easier to parallelise. It’s much simpler to run curl 100 times per second than it is to make 100 requests per second on a desktop web browser by clicking on the interface; I confess I never was any good at DotA and my APM is terrible.
Simulating a web browser with curl
The obvious answer is to use a web page testing library like Selenium, that provides programmatic access to a simulated web browser. Rapid requests with Selenium would replicate the demand on the server in a high-traffic scenario very closely. But a little Bash script that invokes curl sounds much faster to write than a program that needs to be built with a Selenium dependency, configuring the browser setup, and so on. Time saved programming can be reallocated to friends, family, or programming something else, like new features for my S3 file store web service written with Spring Boot.
Selenium is itself simulating a web browser, but can I simulate that simulation with curl? All the browser is doing is requesting the HTML of the web page and the resources that appear on it. On our test page, that amounts to:
- The HTML page
- 4 CSS files
- 13 JS scripts
- 6 image files
- 1 font file
25 resources altogether. So to simulate a page load, we simply curl all of those things at once. This is the page-load.sh script I put together:
time curl https://blog.bergw.xyz/2025/03/22/bergw-xyz-site-design-and-architecture-part-3-www/ 1>/dev/null &
time curl https://blog.bergw.xyz/wp-includes/blocks/image/style.min.css?ver=6.7.2 1>/dev/null &
[3 more CSS files]
time curl https://blog.bergw.xyz/wp-includes/js/jquery/jquery.min.js?ver=3.7.1 1>/dev/null &
[12 more JS files]
time curl https://blog.bergw.xyz/wp-content/uploads/2025/02/doom_background_dark.png 1>/dev/null &
[5 more image files]
time curl https://blog.bergw.xyz/wp-content/themes/twentytwentyfive/assets/fonts/manrope/Manrope-VariableFont_wght.woff2 1>/dev/null &
Each line of the script takes the same form:
timetimes how long each resource request takes.curlmakes the request.- Next comes the URL of the resource.
1>/dev/nullpreventscurlfrom printing the resources into the console.&assigns each command to a background process, so all thecurlinvocations in the script are immediately backgrounded and begin simultaneously.
Let’s invoke our script:
./page-load.sh 2>&1 | grep real2>&1 redirects the error stream to the standard stream so that we can grep for the real time that each call to curl takes to complete, ignoring the user and system times that relate to process scheduling.
$ ./page-load.sh 2>&1 | grep real
real    0m0.148s
real    0m0.148s
real    0m0.145s
real    0m0.166s
real    0m0.169s
real    0m0.160s
real    0m0.156s
real    0m0.166s
real    0m0.158s
real    0m0.164s
real    0m0.149s
real    0m0.179s
real    0m0.157s
real    0m0.164s
real    0m0.169s
real    0m0.212s
real    0m0.202s
real    0m0.205s
real    0m0.239s
real    0m0.260s
real    0m0.282s
real    0m0.366s
real    0m0.357s
real    0m0.451s
real    0m0.710s
Of our 25 resources, the slowest one is fully downloaded in 0.710s, so a web browser can load the page about that quickly.
Let’s increase the load a little bit: two simultaneous page loads.
./page-load.sh 2>&1 | grep real & ./page-load.sh 2>&1 | grep real &This is the same command as before, repeated. & is used to background each request.
$ ./page-load.sh 2>&1 | grep real & ./page-load.sh 2>&1 | grep real &
[1] 10293
[2] 10295
real    0m0.179s
[...]
real    0m1.184s
That’s 50 resources requested this time, the slowest one coming in at over a second. The latency might already be becoming noticeable.
For 3 simultaneous requests, the slowest resource takes only about 80ms more than it did for 2 requests. What about, I don’t know, 10 simultaneous requests?
$ ./page-load.sh 2>&1 | grep real & ./page-load.sh 2>&1 | grep real & ./page-load.sh 2>&1 | grep real & ./page-load.sh 2>&1 | grep real & ./page-load.sh 2>&1 | grep real & ./page-load.sh 2>&1 | grep real & ./page-load.sh 2>&1 | grep real & ./page-load.sh 2>&1 | grep real & ./page-load.sh 2>&1 | grep real & ./page-load.sh 2>&1 | grep real &
[1] 12603
[2] 12605
[3] 12607
[4] 12609
[5] 12611
[6] 12613
[7] 12615
[8] 12617
[9] 12619
[10] 12621
real    0m0.376s
real    0m0.494s
real    0m0.725s
real    0m0.766s
real    0m0.778s
[...]
real    0m1.999s
This time, even the smallest, fastest-loading resources are taking as long to download as the entire page in the first test.
But the server is still responding in a reasonably timely manner. So how much punishment can we dish out before the instance cries no más? I put 10 invocations of page-load.sh (250 calls to curl in total) into another script, sugar_ray.sh, and ran it once a second.
$ i=0; while true; do echo "iteration $i"; ./sugar_ray.sh; let "i++"; sleep 1; done
iteration 0
iteration 1
[...]
To my surprise, it withstood the pressure! I loaded the index page on my phone a few times as the load test ran, and there was a hardly-noticeable increase in the loading time.
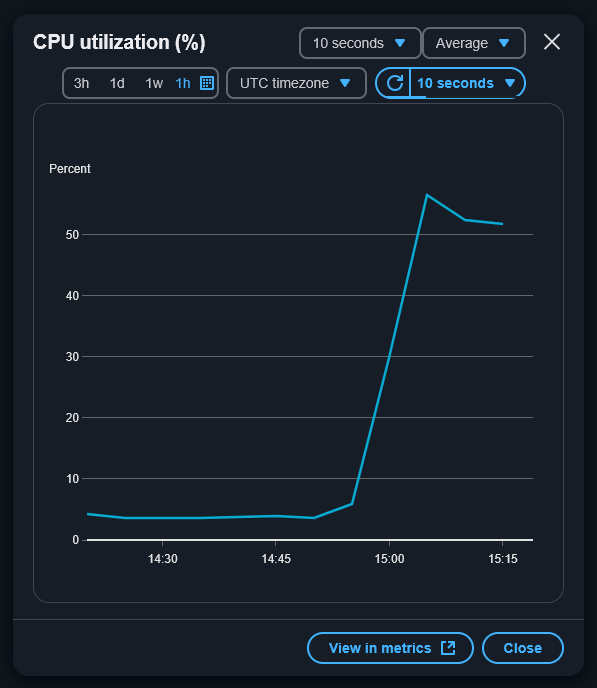
I steadily increased the number of calls to page-load.sh, eventually reaching a parallelisation limit on my machine: the iteration messages took much longer than a second each to appear, blocked by the curl invocations. I had reached the edge of the napkin. The hardest I was able to push the instance was to around 50% CPU utilisation.
There’s nothing left for it. What happens when we take the safety off and just hammer the instance with as many requests as possible? No sleep statement, just bombard the server with as many requests as we have available web sockets. As a bonus, let’s request the index page of the blog, to make the instance work even harder compiling post previews and generating the index before responding.
I’ve added super_fight to the script name in honour of Roberto Durán vs. Sugar Ray Leonard II.
$ i=0; while true; do echo "iteration $i"; ./sugar_ray_super_fight.sh; let "i++"; doneAnswer: performance gradually degrades until, after about ten minutes, it becomes completely unresponsive and the instance needs to be restarted in the console.

Not quite as impressive as Durán, who made it to round 8 before capitulating, but then again Sugar Ray wasn’t throwing 100 punches per second.

This unsophisticated testing has shown that the blog can easily handle one request every one or two seconds. Even under heavy load, the instance continues to respond normally for about ten minutes before increased latency becomes a problem.
As for scaling up: for the time being, I plan to keep tinkering with blogging platforms on the EC2 instance, and to look out for my CloudWatch alert notifications for high CPU utilisation to warn me of increases in traffic.
Leave a Reply